See how overdoses center around T stations, part of a public trove of health issue mapping
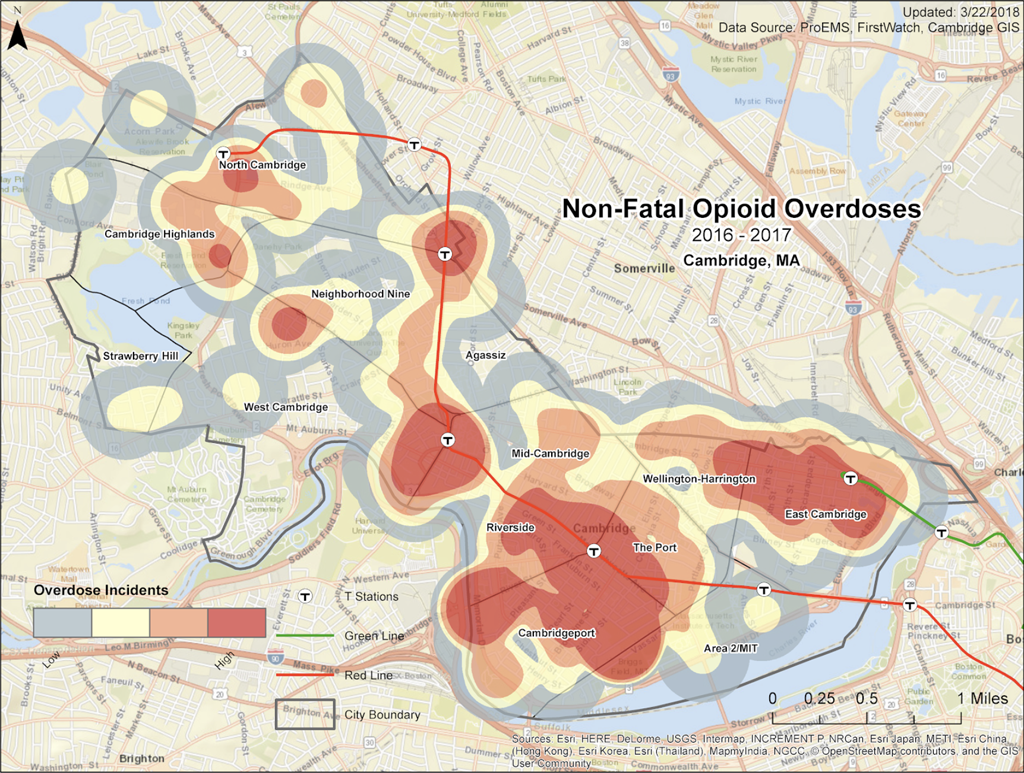
Where do people overdose on drugs in Cambridge? Mostly near MBTA subway stops.
We know this because the city’s Public Health Department has, for the first time, drawn a map that shows the concentration of nonfatal opioid overdoses per square mile. Like drops of blood spreading into the surrounding area, the darkest blobs represent the places of highest overdose density. And those areas are near every T station in Cambridge except Kendall, with a couple of other spots along Concord Avenue.
Other maps prepared by the department’s Epidemiology and Data Services unit show points of difference: homeless people who overdose hew more closely to T stops, while the overdoses of those who have an address are more dispersed. EMTs who responded to overdose calls determined homeless/non-homeless status; homeless people weren’t included in statistics for residents and nonresidents.
Anna Wielgosz, manager of the health department unit, said the density maps can compare the concentration of nonfatal drug overdoses from one neighborhood to another, but won’t provide numbers of overdoses. And, to protect privacy, the edges of the blobs have been “smoothed” so “the numbers represented by the color bands are approximations,” she said.
The maps are part of an effort to improve overdose surveillance. The department “has collected overdose-related data for many years, but data were messy and incomplete,” according to a February presentation to Cambridge Health Alliance trustees on the CHA public health subcommittee. The Alliance runs the city’s Public Health Department.
The new system uses information from the Alliance’s three hospitals and 15 doctors’ offices; records of Pro-EMS, the city’s ambulance service; the state’s Department of Public Health; and the Aids Action Committee Needle Exchange and Overdose Prevention Program in Central Square.
Maps are an important tool in public health, Wielgosz said. They help officials “appropriately allocate resources to the people and places that need it the most,” she said in a written statement. Mapping can also disclose “previously unknown geographic trends.”
In the case of overdoses, maps such as the charts showing density of nonfatal incidents can help public health officials target prevention efforts, “street outreach,” training for businesses and other resource allocation, Wielgosz said.
At the February meeting, officials told committee members that they intended to do more mapping. Cambridge has joined a program in which the U.S. Centers for Disease Control and Prevention and Robert Wood Johnson Foundation map data by census tract in 500 cities for the prevalence of chronic diseases, unhealthy behavior and prevention.
Epidemiologists showed fascinated committee members the Cambridge maps for prevalence of diabetes, generally indicating the highest prevalence in neighborhoods such as Cambridgeport, The Port, East Cambridge and North Cambridge that contain low-income housing developments. The full complement of maps can be explored here.
The February report to the committee on overdoses was a preview of a more comprehensive offering to be made public later. The presentation included other overdose data showing that homeless people made up less than 20 percent of those who overdosed and survived. And a quarter of overdose victims who were treated at a CHA hospital or clinic made more than one visit to the health care system.