Spending increase on ’15 City Council race far outpaced voter growth from ’13 election (corrected)
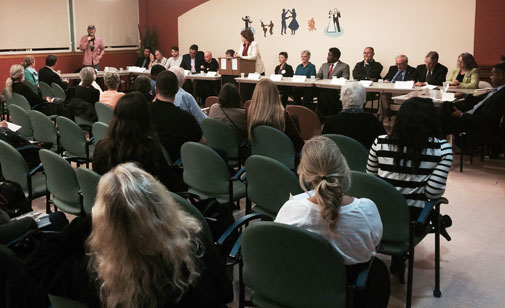
A big increase in City Council campaign spending, a 23-person field and several candidates forums, such as the Ward 6 Democrats event held Oct. 6, didn’t bring a significant increase in ballots cast from previous city elections. (Photo: Marc Levy)
The number of voters in this year’s municipal elections were up a little over half a percent since the elections of 2013, despite campaign spending this year of $651,663, up from a total spend two years ago of $535,871 – or a rise of nearly 22 percent.
In today’s dollars, spending in the 2013 race would be $547,099, making current figures a 19 percent increase. This is despite the number of total candidates decreasing to 23 this year from the 25 who ran for council two years ago.
The candidates making it to the final ballot increased the average spending per No. 1 vote cast by 14.6 percent, to $38.81 from $33.88. This excludes candidate John Sanzone, who dropped out only days before Election Day (but still got 32 No. 1 votes).

How winning votes flowed in this election, and what it means for “slate” campaigning. Click on the image above to see Tom Stohlman’s analysis.
The figures are calculated from data available on the website of the state Office of Campaign & Political Finance. (Please report questions or potential errors resulting from the calculations in the comment section below.)
There remains a core of candidates who refuse to raise or spend money on the campaign, which in the 2013 elections included James Williamson (74 votes) and Elie Yarden (102 votes) with Gary Mello the next lowest-spending at $2.83 spent per vote (getting 107). In this year’s elections the number of candidates spending a minimum grew, starting with three who spent nothing: Williamson (72 votes); Mello (119 votes); and Ilan Levy (153 votes). First-time candidate Paul Mahoney’s campaign spending amounted to 50 cents per vote, because he netted 251 No. 1 votes.
But there were far more candidates on the high-spending end of the spectrum. Nadeem Mazen won reelection – getting the most No. 1 votes and becoming the only candidate to become immediately reelected in Cambridge’s “proportional representation,” ranked form of voting – with a spend of $86,112, up a staggering 288 percent from the $22,188 he reported spending for his campaign two years ago. While spending 94 percent more per vote ($44.64 this year, compared with $23 two years ago), he also raised the total No. 1 votes he got by roughly the same amount: 96 percent.
That’s a better outcome than was seen for vice mayor Dennis Benzan, who spent a total $79,636 this year on his campaign, up 41 percent from two years ago, but saw an 11 percent decrease in the total No. 1 ballots coming in despite spending $68.71 per vote.
Here’s an interactive table showing how campaigners from two years ago fared and spent in this year’s election (with incumbents marked by a parenthetical “i”):
| Candidate | Spent in 2013 | No. 1 votes in 2013 | Spent per vote in 2013 | Spent in 2015 | No. 1 votes in 2015 | Spent per vote in 2015 | Change in spending | Change in No. 1 votes |
|---|---|---|---|---|---|---|---|---|
| Benzan, Dennis (i) | $56,393 | 1,302 | $43.31 | $79,636 | 1,159 | $68.71 | 41% | -11% |
| Carlone, Dennis (i) | $24,099 | 1,151 | $20.94 | $30,346 | 1,002 | $30.29 | 26% | -13% |
| Cheung, Leland (i) | $36,958 | 2,392 | $15.45 | $32,935 | 1,189 | $27.70 | -11% | -50% |
| Kelley, Craig (i) | $11,750 | 1,093 | $10.75 | $29,725 | 1,434 | $20.73 | 153% | 31% |
| Maher, David (i) | $56,131 | 1,460 | $38.45 | $44,553 | 1,637 | $27.22 | -21% | 12% |
| Mazen, Nadeem (i) | $22,188 | 984 | $22.55 | $86,112 | 1,929 | $44.64 | 288% | 96% |
| McGovern, Marc (i) | $38,144 | 1,189 | $32.08 | $68,911 | 1,202 | $57.33 | 81% | 1% |
| Mello, Gary | $303 | 107 | $2.83 | $0 | 119 | $0 | -100% | 11% |
| Moree, Gregg | $3,101 | 38 | $81.61 | $13,206 | 78 | $169.30 | 326% | 105% |
| Simmons, E. Denise (i) | $41,833 | 1,183 | $35.36 | $58,191 | 1,715 | $33.93 | 39% | 45% |
| Toomey, Tim (i) | $34,397 | 1,459 | $23.58 | $48,154 | 1,416 | $34.01 | 40% | -3% |
| vanBeuzekom, Minka | $19,113 | 874 | $21.87 | $45,689 | 1,014 | $45.06 | 139% | 16% |
| Williamson, James | $0 | 74 | $0 | $0 | 72 | $0 | 0% | -3% |
Notably, Mayor David Maher spent 21 percent less from the previous election cycle but saw as 12 percent gain in No. 1 votes. Third-term councillor Leland Cheung won reelection spending 11 percent less, but saw his No. 1 ballots plummet by half; in the past two elections, he’d taken the most No. 1 votes by a significant margin.
Councillor Craig Kelley changed his approach to campaigning as significantly as he changed his approach to governing in a term that saw him take on a legislative aide after several terms deeming it a waste of public money and become a centrist while shaking off a self-avowed role as “Councillor No” on such issues as city manager appointments. Jolted by a close race in 2013 by Kelley’s account, he went from raising $11,412 two years ago to raising $38,728 in the current election year, an increase of239 percent, and put some of that money into joining a “Unity Slate” with six other council incumbents. He spent 153 percent more from the last race to this one and saw his No. 1 votes jump by 31 percent.
Here’s a complete table for this year’s candidates based on state data, including a search function. (A similar interactive and searchable table for the previous election has been added to a story on dollars-per-vote for the 2013 election.) This table does not include Sanzone. (Again, please report questions or potential errors resulting from the calculations in the comment section below; and again, incumbents are marked by a parenthetical “i.”)
Cost per vote in the City Council race, 2015
| Candidate | Campaign money raised in 2015 | Campaign money spent in 2015 | How many No. 1 votes | Cost per No. 1 vote |
|---|---|---|---|---|
| Benzan, Dennis (i) | $73,806 | $79,636 | 1,159 | $68.71 |
| Cheung, Leland (i) | $76,231 | $32,935 | 1,189 | $27.70 |
| Connolly, Mike | $45,937 | $37,161 | 841 | $44.19 |
| Courtney, Kim | $1,870 | $1,589 | 72 | $22.07 |
| Davidson, Mariko | $15,203 | $12,608 | 853 | $14.78 |
| DeGoes, Plinio | $4,550 | $4,159 | 51 | $81.54 |
| Dennis, Carlone (i) | $34,235 | $30,346 | 1,002 | $30.29 |
| Devereux, Jan | $55,444 | $51,151 | 1,307 | $39.14 |
| Dietrich, Xavier | $1,960 | $1,786 | 27 | $66.14 |
| Kelley, Craig (i) | $38,728 | $29,725 | 1,434 | $20.73 |
| Levy, Ilan | $0 | $0 | 153 | $0 |
| Maher, David (i) | $51,723 | $44,557 | 1,637 | $27.22 |
| Mahoney, Paul | $100 | $126 | 251 | $0.50 |
| Mazen, Nadeem (i) | $67,480 | $86,112 | 1,929 | $44.64 |
| McGovern, Marc (i) | $68,696 | $68,911 | 1,202 | $57.33 |
| Mello, Gary | $0 | $0 | 119 | $0 |
| Moree, Gregg | $12,800 | $13,206 | 78 | $169.30 |
| Simmons, E. Denise (i) | $59,891 | $58,191 | 1,715 | $33.93 |
| Toomey, Tim (i) | $41,738 | $48,154 | 1,416 | $34.01 |
| vanBeuzekom, Minka | $45,615 | $45,689 | 1,014 | $45.06 |
| Waite, Romaine | $3,968 | $3,749 | 274 | $13.68 |
| Williamson, James | $0 | $0 | 72 | $0 |
| $714,561 | $649,787 | 17,795 | $38.81 (average) |
This post was updated Nov. 29, 2015, to correct Craig Kelley’s fundraising amounts in 2015 and its percent increase from the 2013 election year.